 Understanding how successful companies like Salesforce, Adobe, and Apple generate revenue and manage their expenses is essential for business innovation. By analysing their business models, we can learn valuable lessons about balancing revenue streams, managing operational costs, and optimising the cost of products and services. This knowledge can help you make informed decisions about where to invest in your own business, how to structure your product offerings, and where to cut costs without sacrificing quality or customer satisfaction. Ultimately, gaining insights into financial dynamics can be the key to refining your business model and achieving sustainable growth. Let’s take a look, how do the big tech players make and manage their money?
How Salesforce Makes Money?
Salesforce primarily generates revenue through its diverse range of cloud-based software solutions. These are segmented into six key areas:
- Service ($2B) : Focuses on customer service and support software solutions.
- Sales ($1.9B) : Sales cloud solutions help businesses manage their sales processes.
- Platforms ($1.6B) : Provides tools for app development and integration.
- Marketing ($1.2B) : Digital marketing and advertising solutions.
- Data ($1.2B) : Data management and analytics services.
- Professional Services ($0.7B) : Consulting and implementation support for Salesforce products.
Overall, Salesforce earns $8.6 billion in revenue, with significant costs associated with operations ($5B), resulting in a net profit of $1.2 billion. 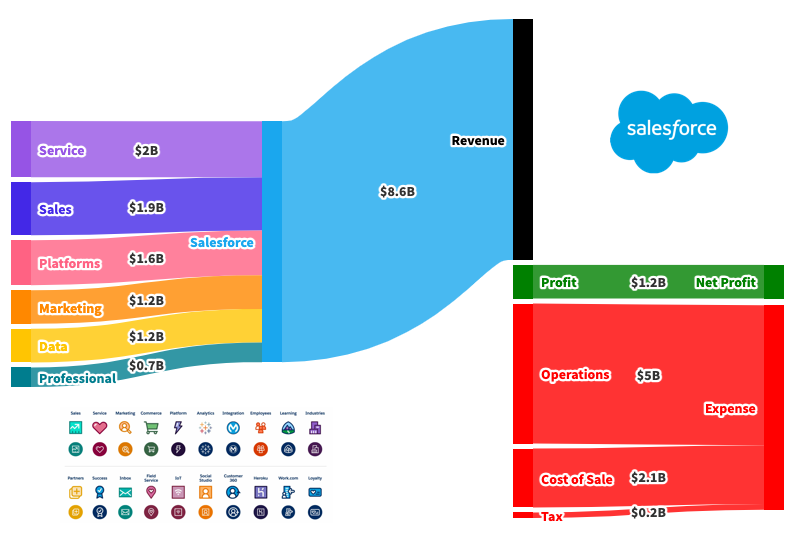
How Adobe Makes Money?
Adobe’s business model is built around three primary revenue streams:
- Digital Media ($3.6B) : Subscriptions for software like Photoshop, Illustrator, and After Effects.
- Experience ($1.2B) : Digital marketing and experience management solutions.
- Publishing ($0.1B) : Document services and traditional publishing tools.
Adobe’s total revenue is $4.9 billion, with $2.6 billion in operational costs and a net profit of $1.4 billion. The focus remains on creative software and digital experience management. 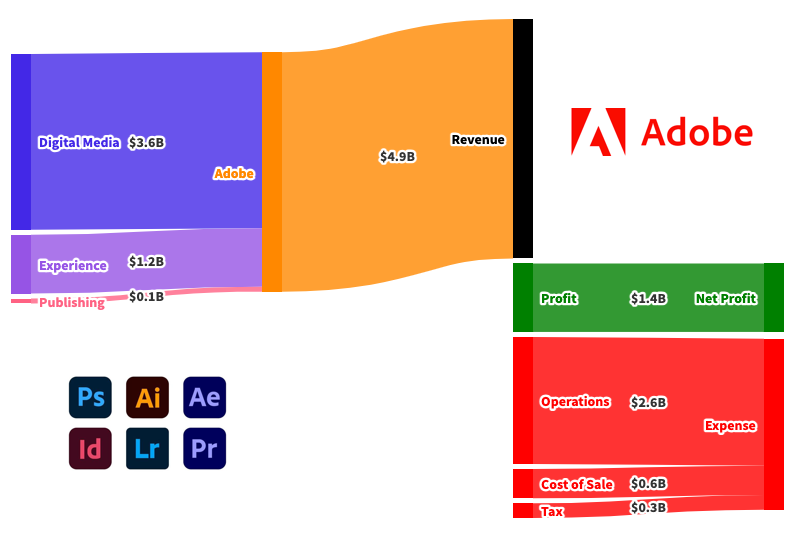
How Apple Makes Money?
Apple’s diverse product lineup contributes significantly to its revenue:
- iPhone ($51.3B) : The flagship product generates the bulk of revenue.
- Services ($8.8B) : Includes Apple Music, iCloud, and the App Store.
- Watch ($20.9B) : Smartwatches and wearables.
- MacBook ($6.8B) : Laptops and desktop computers.
- iPad ($6.8B) : Tablets for consumer and professional use.
Apple’s total revenue is a staggering $74.8 billion. With operational costs of $13.7 billion and cost of revenue at $52.9 billion, they achieve a net profit of $24.2 billion. 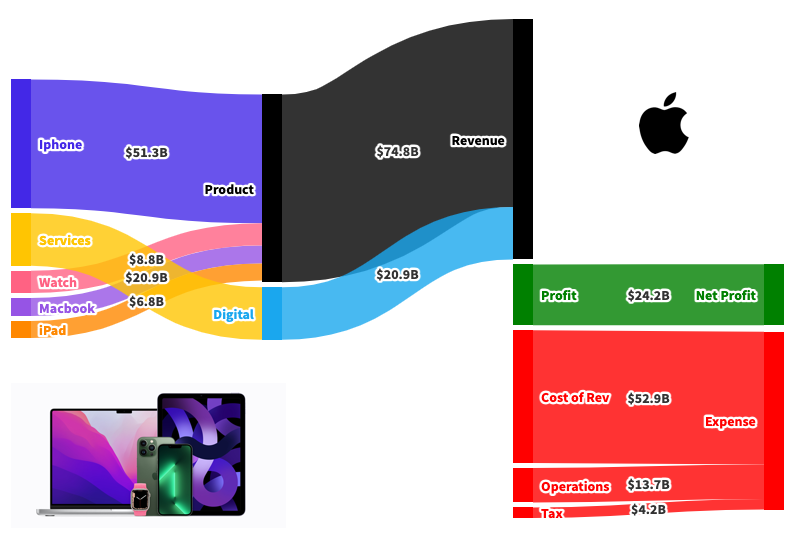
How Google Makes Money?
Google’s revenue for Q3 FY23 primarily comes from ad revenue —a massive $59.7B , up 9% year-on-year (Y/Y). This includes their core business in Search advertising ($44B, up 11% Y/Y) and other areas like YouTube ads ($8B, up 12% Y/Y) and Google AdMob ($7.7B). They also bring in revenue from Google Cloud ($8.5B, up 22% Y/Y) and Google Play services ($8.4B, up 21% Y/Y). After covering costs of $33.2B , they end up with a gross profit of $43.5B , representing a 57% margin. Their operating expenses, including R &D ($11.3B) and sales/marketing, still allow for a healthy net profit of $19.7B. 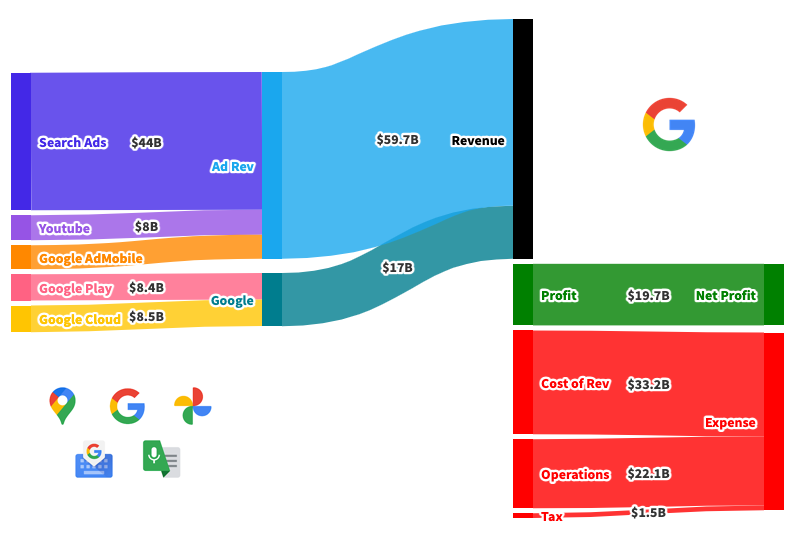
How Amazon Makes Money?
Amazon reported $143.1B in revenue in Q3 FY23, up 13% Y/Y. Their largest segment is still the online store at $57.3B. But a significant portion comes from their third-party sellers ($34.3B) and advertising ($23.1B). Amazon Web Services (AWS) also continues to grow, contributing $7B to their profits. Despite high operating costs, including $22.3B for fulfilment and $21.2B for technology & content, they recorded a net profit of $9.9B , aided by their 11.2B operating profit from their 8% margin. 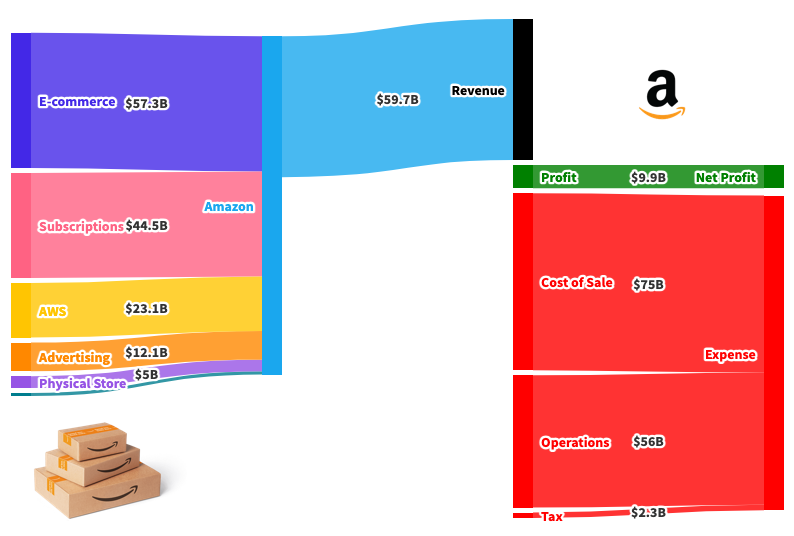
How Microsoft Makes Money?
Microsoft’s Q1 FY24 financial results showcase how the tech giant continues to thrive across its key business areas. With total revenue hitting $56.5 billion —a 13% year-on-year (Y/Y) increase —the company’s diverse range of products and services are driving impressive growth. Breaking it down, Microsoft’s Productivity & Business Processes (think Microsoft 365 and LinkedIn) brought in $18.6 billion , with a solid 54% operating margin , growing by 13% Y/Y. Their Intelligent Cloud division, which includes the ever-popular Azure, saw even more growth, reaching $24.3 billion in revenue—up 19% Y/Y —with a 48% operating margin. Lastly, the More Personal Computing segment (Windows, Xbox, and the like) generated $13.7 billion , showing 3% Y/Y growth and a 31% operating margin. What’s remarkable is that Microsoft managed to achieve a 71% gross margin , turning $40.2 billion of revenue into profit after costs. After accounting for $13.3 billion in operating expenses (including R&D and marketing), the company secured a net profit of $22.3 billion , representing a 39% margin. From its robust cloud services to its widely used productivity tools, Microsoft’s ability to balance revenue growth with efficient cost management has kept it firmly at the forefront of the tech world. 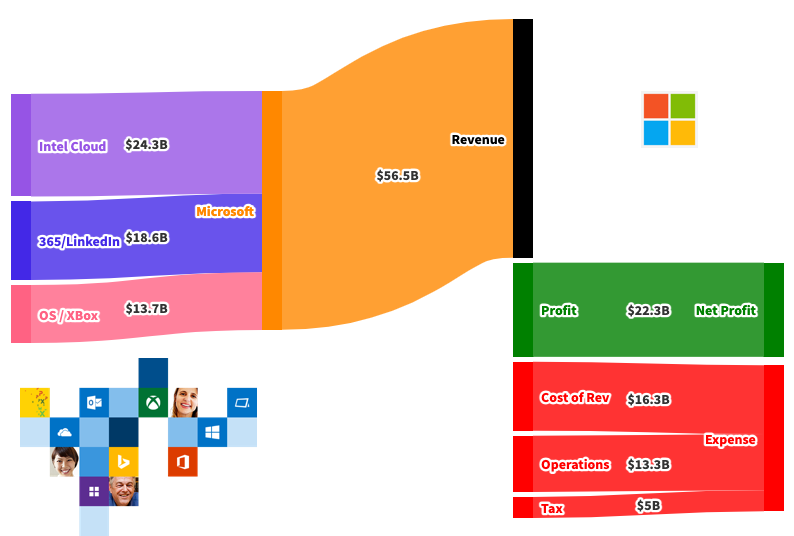
###